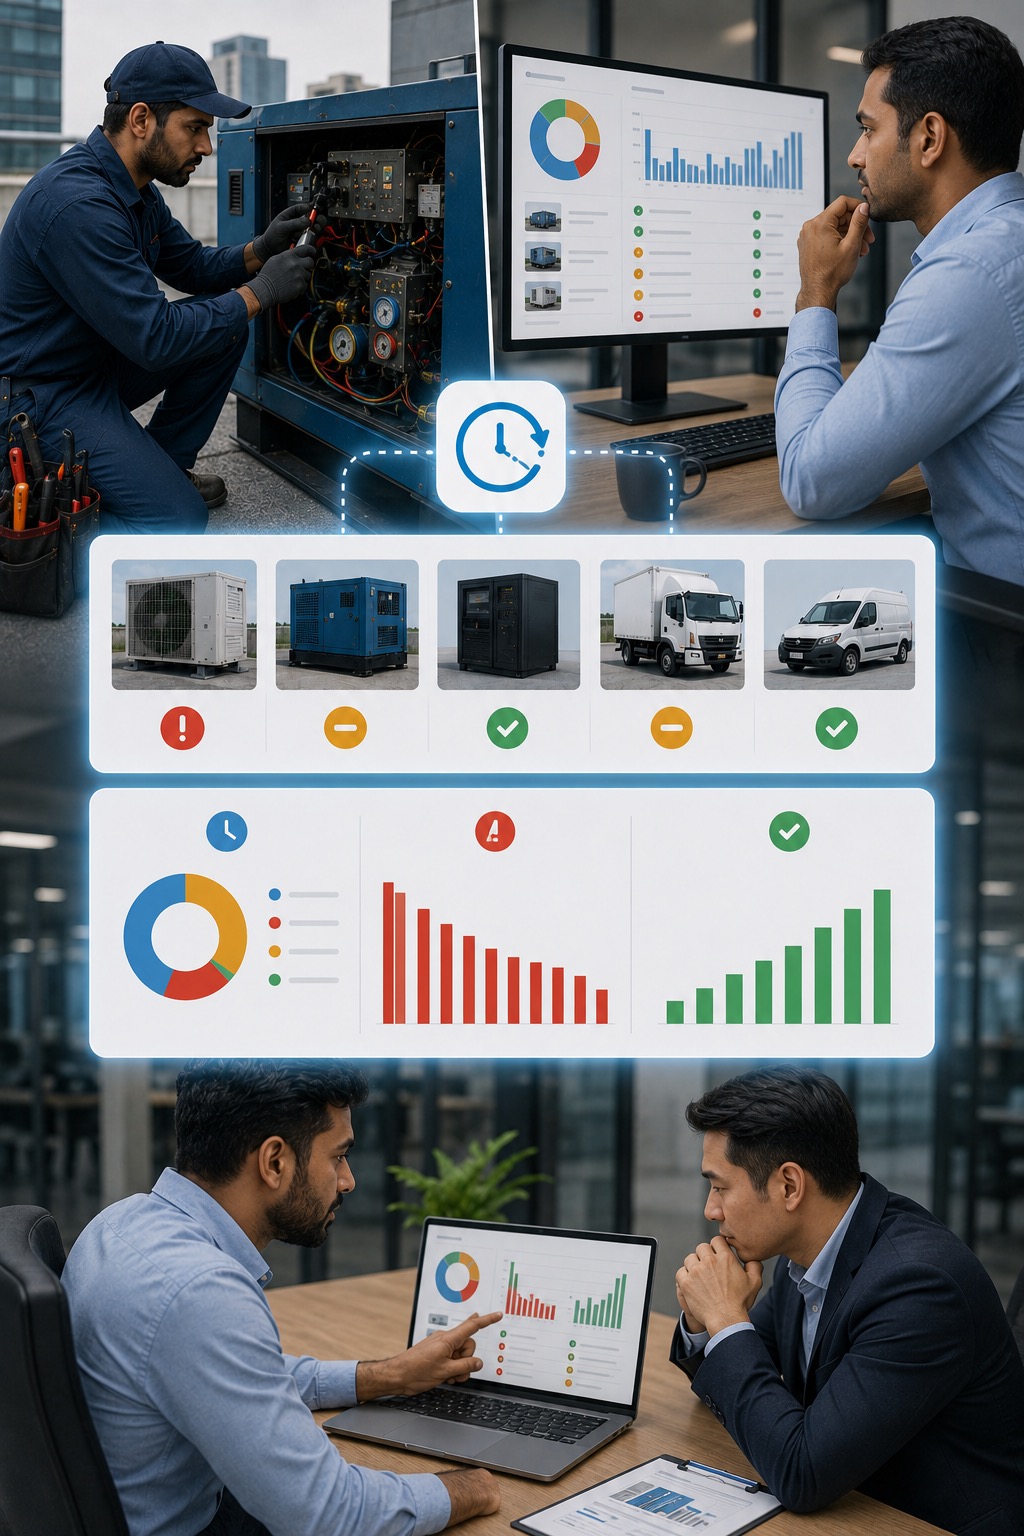
Equipment keeps breaking. You keep fixing it. At some point, someone has to ask why.

FieldEx captures the fault, the resolution, and the time taken on every job — so you can see which assets are costing you the most and what to do about it.

The problem

Reactive maintenance is expensive. Every unplanned breakdown costs time, parts, and often a client relationship. The companies that reduce breakdowns over time are the ones that can see patterns in their own data.

Most teams cannot.

1.
You are fixing the same assets repeatedly with no explanation.

A piece of equipment has been repaired six times this year. Each repair is handled in isolation. No one has connected them to ask why this asset keeps failing.

2.
Fault and resolution data is not being captured.

Jobs are closed with no record of what the fault was or how it was resolved. Over time, this means you have no data to learn from.

3.
You cannot tell your clients which of their assets are at risk.

A client asks whether their equipment is in good condition. You do not have the data to answer confidently. The best you can do is tell them when it was last serviced.

4.
Downtime is measured in complaints, not in numbers.

You know when equipment is down because a client calls. But you do not know how long it was down, how long it took to fix, or whether that is getting better or worse over time.

How it works with FieldEx

With FieldEx, every job captures the fault and the resolution — and that data builds into something you can act on.

1.
Fault and resolution are logged on every job.

When a technician closes a job, they record the fault they found and the resolution they applied. Over time, this creates a dataset of what is breaking and how it is being fixed.

2.
Asset analytics show you which equipment is failing most.

FieldEx calculates how long assets typically take to repair (MTTR) and how frequently they fail (MTBF). You can see at a glance which assets are underperforming.

3.
Patterns become visible over time.

The same fault appearing repeatedly on the same asset type is a signal. The same part being replaced on a regular cycle is a signal. FieldEx surfaces these patterns from your own job data.

4.
You can report on downtime with real numbers.

How long was this asset out of service? How long did it take to fix? How does that compare to last quarter? These are questions FieldEx can answer from the data your team is already capturing.

Key capabilities

Fault and resolution logging

Technicians record the fault found and resolution applied on every job. Configurable per asset type so only relevant options appear.

MTTR and MTBF tracking

FieldEx calculates mean time to repair and mean time between failures per asset. See which equipment is most unreliable.

Full asset repair history

Every repair job linked to an asset is stored in that asset's record. See the complete failure pattern over time.

Reporting module

Build reports on fault types, resolution patterns, repair frequency, and technician response times across any time period.

Power BI connector

Connect FieldEx data to Microsoft Power BI for advanced analysis and dashboards.

Configurable fault picklists

Set the fault types relevant to each asset type. Data is consistent and comparable across jobs.

Who is this for

This is for you if:

You are accountable for equipment uptime across client sites or your own facilities
The same assets keep breaking and you do not have the data to understand why
You cannot currently produce a report on downtime, repair frequency, or fault patterns
A client or leadership team is asking for evidence of asset performance
You want to move from reactive to preventive maintenance but do not know where to start
Solar Panel Photo

See how it works for your team